
Intro
GameChanger’s Team Manager is built on top of a Node.js API server. Although we’ve had a lot of monitoring and logging throughout it’s lifetime, most of our metrics were at an aggregate level. By alerting on symptoms, it was easy to spot that something was broken, but not necessarily what or why. With the server handling over 100 million requests per day, over 1000 per second, we needed a better way to drill into what the server was doing and figure out causes. Operating at that scale meant that local testing was at best an approximation of production realities.
Integrating Datadog APM (Application Performance Monitoring) has solved a lot of our observability issues. It wasn’t always straightforward to work with—some of the tooling isn’t obvious and the documentation is all over the place—but now that things are up and running, it’d be hard to imagine a world without it.
We’ve also open sourced some of the APM utility code we made along the way as an NPM package.
Outline
- What is APM?
- What does Datadog provide?
- What challenges did we face?
- What doesn’t Datadog provide? A feature wishlist
- Introducing @gamechanger/datadog-apm
- Conclusion
What is APM?
APM Stands for Application Performance Monitoring. It can take different forms from one offering to another, but it generally consists of breaking down what your server is doing while accomplishing a specific unit of work. For example, if your server offers an API, the APM will keep track of when a request starts, what functions are called to handle that request, what database queries are performed, and what the response is.
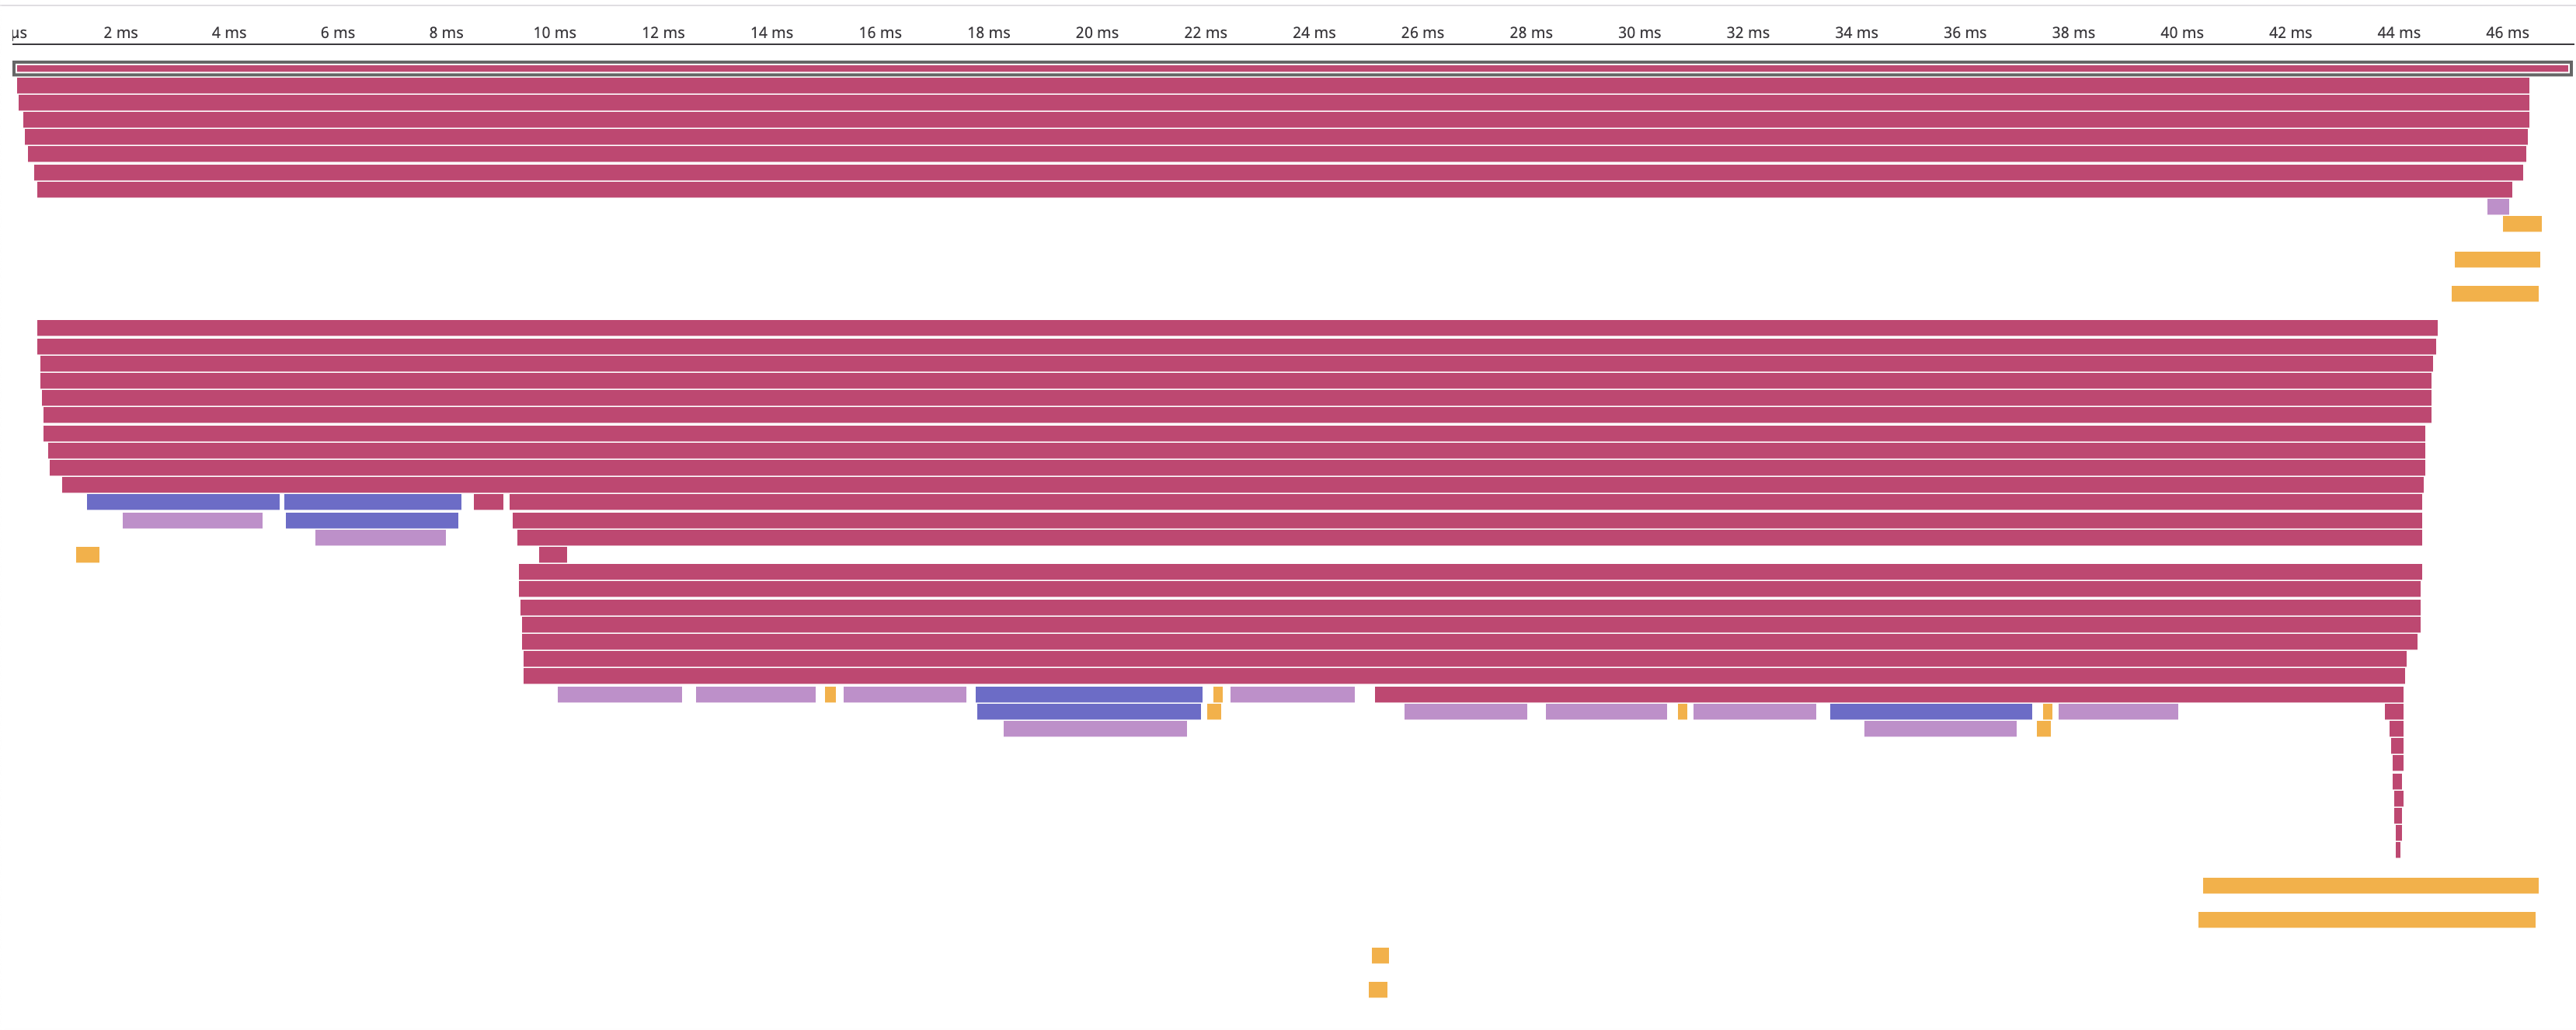 A representative flame chart from Datadog’s APM for one API request.
In Datadog’s words, APM “provides you with deep insight into your application’s performance - from automatically generated dashboards for monitoring key metrics, like request volume and latency, to detailed traces of individual requests - side by side with your logs and infrastructure monitoring”.
What does Datadog provide?
In addition to APM, Datadog has a host of monitoring options—logging, monitoring, analytics, synthetics—and their web UI gracefully ties them all together.
In order to make use of their offerings, Datadog provides a number of client libraries. For the purposes of this post we’ll focus on their dd-trace Node.js library which enables APM.
dd-trace has two sources of documentation: there is general Datadog APM documentation along with library specific documentation. Both are adequate to get things up and running, but for our needs we had to turn to a third source of documentation, the source code itself. Fortunately, the code is pretty straightforward, applying the same basic patterns across each of the libraries that it wraps.
Although written in vanilla Javascript, dd-trace comes bundles with type definitions for typescript.
What challenges did we face?
Implementing APM wasn’t always straightforward; as mentioned earlier, we often had to reference the source code to accomplish what we needed.
Getting tracing out of the way
This was the hardest part: our philosophy is that monitoring and analytics code should not impact business logic code. Ideally, adding or removing tracing should be a single line change that doesn’t touch the business code at all. Since our code makes heavy use of classes, decorators were an obvious language feature to accomplish our goal.
(Note: although decorators are only a stage 2 proposal for ECMAScript, they are available as a feature in Typescript (with the experimentalDecorators flag turned on) and through babel if you’re using vanilla JS.)
Decorators allow us to augment classes and class methods without modifying the body of either. For example, if we had a decorator to log the name of the method being called, we could add it with a one line PR. Similarly, when we’re done debugging that function, we can cleanly remove that one line without being afraid of accidentally changing business logic.
// Example PR Diff adding logging to MyClass.method
class MyClass {
+   @logMethodName()
    method() {}
}
With that in mind, we wanted our traced code to look like this:
// Trace *all* methods of a class
@APM.trace()
class GameChanger {
    public foo() {}
    private bar() {}
}

// Trace *individual* methods of a class
class GameChanger {
    @APM.trace()
    public foo() {}
    private bar() {}
}
This also allows easy modification of how we’re tracing our code—configuration of the traced code is also separate from the business logic.
// The decorator can be configured to override the defaults
class EmailQueue {
    @APM.trace({ serviceName: 'queue', spanName: 'queue.message' })
    public async pop() {}
}
The pattern itself isn’t new, and the Datadog Java client library actually provides this as its interface:
import datadog.trace.api.Trace;

public class MyJob {
  @Trace(operationName = "job.exec", resourceName = "MyJob.process")
  public static void process() {
    // your method implementation here
  }
}
For Node.js, however, you currently have to manually start and stop your spans, as seen in the docs:
const tracer = require('dd-trace').init()

// sync code
const span = tracer.startSpan('web.request')

span.setTag('http.url', '/login')
span.finish()
For synchronous code, like that above, this manual tracing is straightforward. Things get quite cumbersome, though, when dealing with async functions. Javascript has no built in way to detect if a function is a promise, with the best approximation being to check if the returned value is a function itself. And example of this is the dd-trace-js internal code itself:
class DatadogTracer extends Tracer {
  ...

  trace (name, options, fn) {
    options = Object.assign({}, {
      childOf: this.scope().active()
    }, options)

    const span = this.startSpan(name, options)

    addTags(span, options)

    try {
      if (fn.length > 1) {
        return this.scope().activate(span, () => fn(span, err => {
          addError(span, err)
          span.finish()
        }))
      }

      const result = this.scope().activate(span, () => fn(span))

      if (result && typeof result.then === 'function') {
        result.then(
          () => span.finish(),
          err => {
            addError(span, err)
            span.finish()
          }
        )
      } else {
        span.finish()
      }

      return result
    } catch (e) {
      addError(span, e)
      span.finish()
      throw e
    }
  }

  ...
}
Wrapping each function like that was out of the question, again we wanted to add a single line decorator and be done with it. There were some gotchas, especially in getting typescript to play nicely with a decorator handling both classes and methods, but in the end it worked out great. We made a helper library to hide the complexity behind a decorator interface, which you can read about further down the page.
Making tags searchable
When we started, you could only search tags that were added to your root span, but there was no documented way to access the root span. There is, however, an accessible property on the Koa context passed to each piece of middleware, context.req._datadog.span. Using that, we were able to add tags to our root span and make them into searchable facets. This is no longer an issue: facets can be created from nested spans as of the writing of this post. That said, there still may be times you want to add tags (but not global tags) to your root span. We included a getRootSpanFromRequestContext utility function in our helper library.
Marking non-throwing spans as errors (and dealing with null values)
Knowing whether a span was successful is important in almost every part of consuming APM data. Unfortunately it wasn’t clear straight away how to mark a span as being an error. By default uncaught errors will be flagged, but if your code handles errors you’re out of luck. For example, in our queue processor, if we have an error we push to an error queue but don’t throw anything.
All that it takes is adding a few of the correct tags to a span for everything to work. The issue is that getting a span can be cumbersome. The tracer.scope().active() function will return the current span, if it exists, or null. That means all of your code needs to handle the null case. If you don’t mind having if (span) {} littered about your code, perhaps you should be writing golang. In our case, we ended up with a utility function APM.markAsError(error: Error) that handle getting the current span and dealing with a null span for us. Learn more in our helper library.
Making spans show up in App Analytics
Note: Previously, the documentation on this was less straightforward. It’s also a less pressing issue now that the new “traces” screen has been rolled out.
Getting runtime metrics working
This was our fault—we were on an old version of both the Datadog agent and Node.js. Another dependency kept us from jumping straight to Node 12, but once we were on Node 11, everything was working as expected. If you have issues getting runtime metrics to work, try upgrading to a newer version of node (we were on 8 when we had the issues).
What doesn’t Datadog provide? A feature wishlist
Service page span name selector
This is no longer relevant at the time of posting this article. A dropdown selector allows changing which span name is shown on the service page. Previously you had to manually change the URL to the desired span name.
Working filter estimates
With our number of events, we need some filtering to keep our costs in check. There is a tool to estimate the effect of event filtering on event count, but it was often necessary to simply wait a day to see if the filter had the desired impact.
Extrapolated query metrics
You can pull in App Analytics queries to any dashboard. However, they will be sampled and there is no good way to get an extrapolated number of the total. If you create a search filter to find the number of POST /games requests, App Analytics will show you an upscaled chart in the top left of the page. If you pull that query into a dashboard, the raw number will be shown in the chart. If APM sampling were a simple percent cut of all events, it’d be easy to manually extrapolate, but the sampling is dynamic. That makes the dashboard charts utility questionable.
Custom measures from tags
In App Analytics, the duration tag is special. You get a min/max selector in the facets column, and more importantly it is treated as a “measure” in charting. Custom tags, despite being marked as integer or double, are treated as distinct values which limits their value in filtering and charting.
Introducing @gamechanger/datadog-apm
If you’re writing a Node.js app with any classes, consider checking out @gamechanger/datadog-apm. In our experience, the decorator syntax has made adding tracing a dead simple process. There are some other utility functions and conveniences built in, so you may even find value if you’re not using OOP in your code..
Conclusion
If you’re not using an APM product, you probably should be. For a small performance overhead, you get a completely different class of insights than what logs and request metrics can offer.
Datadog’s APM is a fantastic offering that keeps getting better—the outline of this blog was put together a couple months ago, and by the time of writing much of the “pain point” section was already out of date. Yes, some of the implementation can be cumbersome, but once set up the web UX/UI is responsive and intuitive.