
Preface
Before we begin, I suggest settling in. Unlike my previous post, this one won’t be short. It’ll also be more technical, though I will do my best to link to resources in case you get lost along the way. So my suggestion is get a nice cuppa, turn off notifications, and brace yourself:
We’re going on an adventure.
In the beginning
Back in 2016, when we were all younger and more innocent, Alex Etling wrote a series of blog posts about his learnings in setting up our original data pipeline, which was built around Kafka, which is built upon Zookeeper. I’ll let his blog posts speak for themselves in case you’re interested in that history, though they’re not necessary prerequisites for this post if you’d rather save them for later.
Instead to give you a lay of the land, here’s a high level overview of the data pipeline and data warehouse systems, to function as a map for our adventure:
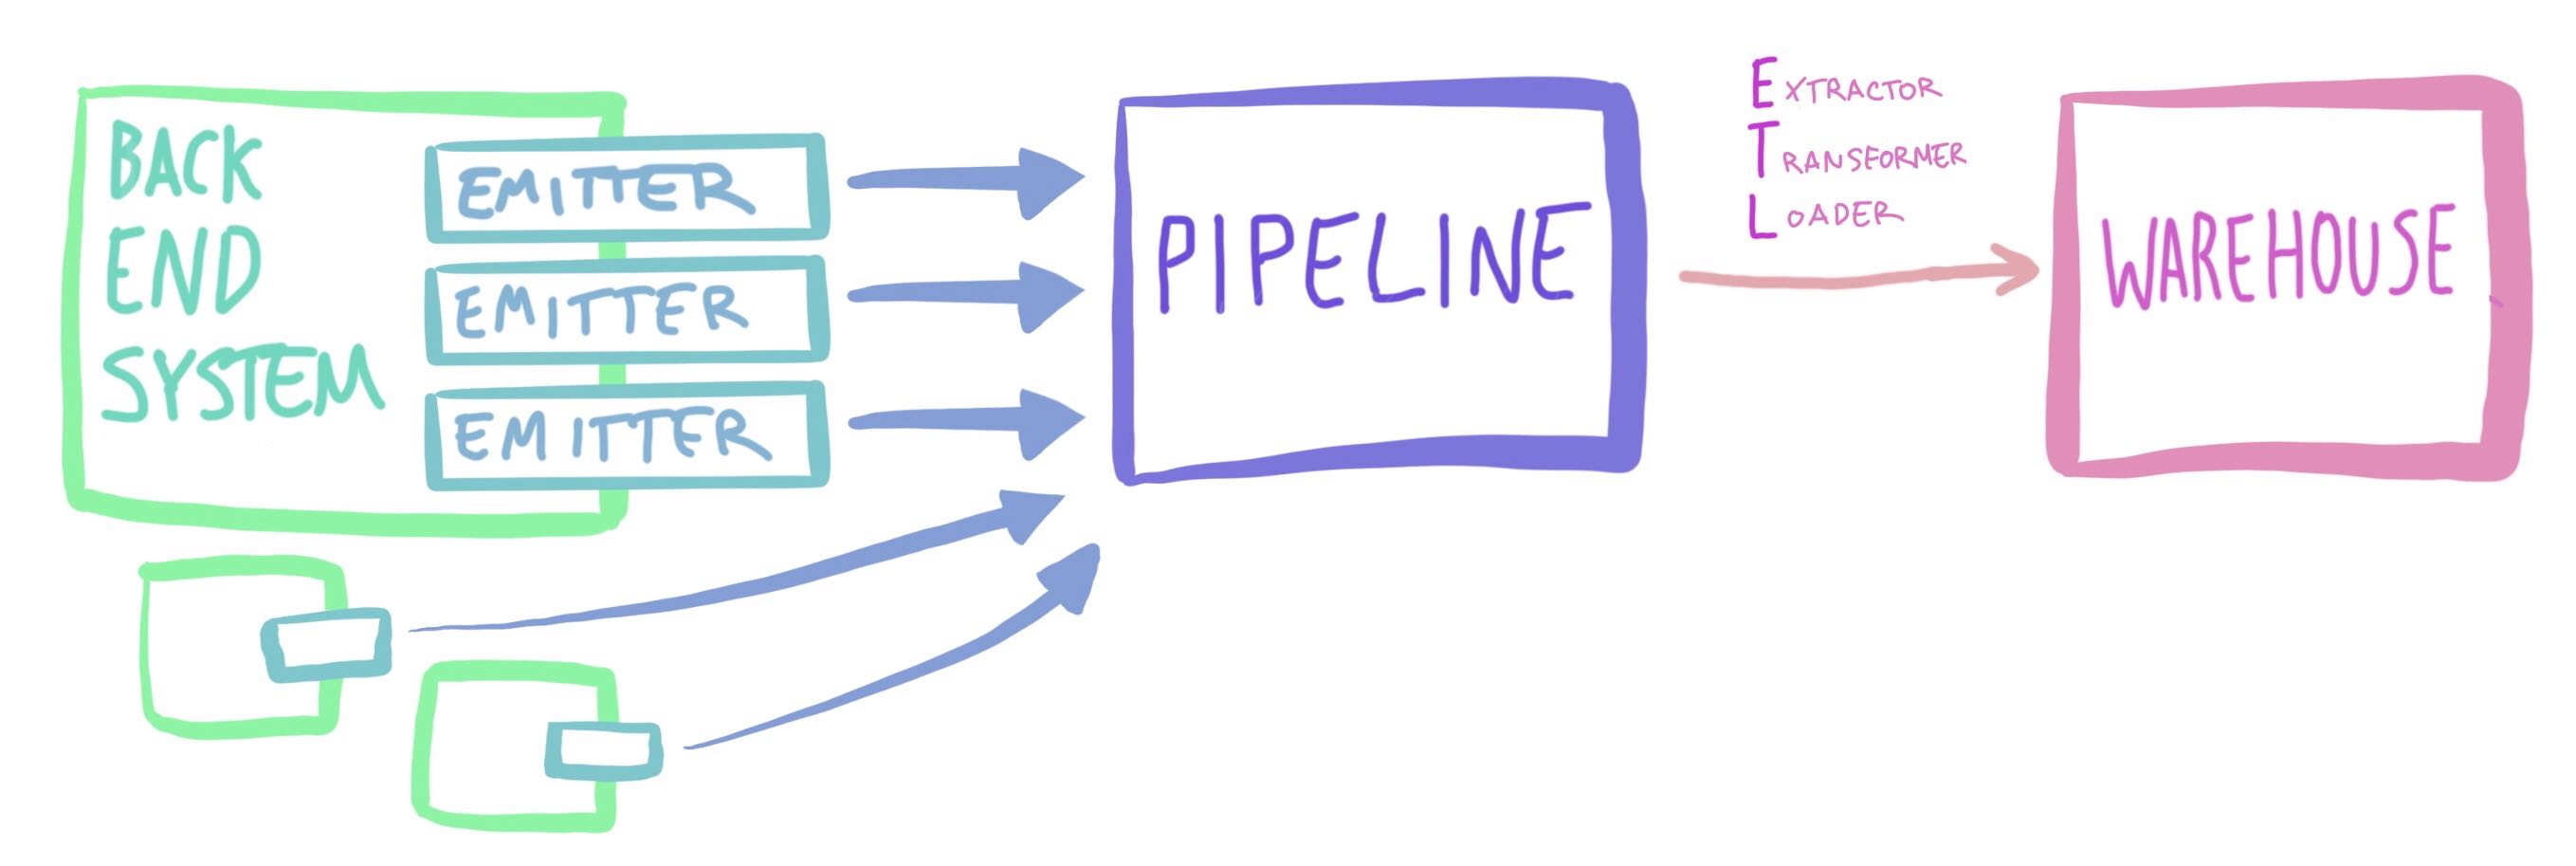
Bringing back this architecture diagram, as it’s so wonderful. [1]
Spiffy, huh?
Thus the Kafka and the Zookeeper clusters, and all the host of them, were finished
This pipeline setup has allowed us to do things like grow our data warehouse, provide business intelligence to data users, and do deep analysis as a data team to answer questions about how we can better serve our customers.
At the same time, a lot has changed around this system: in our infrastructure setup, in Kafka’s capabilities, and in who uses the pipeline and for what. Back then, the desire was to answer a few basic questions about the customers using a variety of data; now the consumers of our data go in hard to look at the nitty gritty details themselves and really understand the complexity in the data to get their answers. What makes a team successful? Are our features helpful to teams across sports and ages? The people need to know.
You cannot know everything a system will be used for when you start: it is only at the end of its life you can have such certainty. [2]

Perhaps one of the biggest changes though was hiring a dedicated data engineer — me! I had the advantage when I started over Alex in that he had had to learn about Kafka and data pipelines from scratch, whereas I started here specifically because I love both of those and had experience with them. Want to talk about event driven architectures? Data on the inside versus on the outside? Logs? Your favorite part of the Kafka documentation? I think the design section is really an underappreciated gem that is super easy to get into and follow. I learned Scala explicitly to work with Kafka and be able to read the source code, which has led me to a passion for functional programming and test driven development. This is what gets me excited to come to work.
But it is important to state that the system I came in to take ownership of was impressive despite its age and dust: there were super detailed dashboards about the metrics, there were tools set up to monitor the clusters, there were libraries for producing into Kafka from outside the JVM when Kafka was still very much JVM only (take a peak at our original Python client if you’d like). The problem was that systems, like code, are for people, and naturally over the course of people’s careers, they will move on to other projects, jobs, and passions. With the original folks gone from the project, a lot of oral knowledge had been lost. What do all the metrics mean? Why is this function of code like this? Also, what does it do?
Let’s take a step back
Today we’re pushing the system harder than ever and don’t have a lot of options we like the look of. We’re two major versions behind so upgrading Kafka is high risk, but that also means we can’t take advantage of things like streams to relieve pressure elsewhere like on our data warehouse with its batch ETL process. Sometimes we encounter problems where the Internet’s main solution is to upgrade our Kafka version, but that’s not exactly something you can do in an incident where you’re trying to make sure you minimize data loss. What if we have a problem and can’t fix it? What if the system goes hard down? Is that it?
We value keeping the systems our customers rely on operational; everything else can wait. Except for the day you realize that you have internal customers, and suddenly this system that seemed less important than all the rest jumps up in the ranking.

Write once, run forever, debug forever
Now this all sounds bad but an important question to ask is how bad? Light rain when you don’t have an umbrella bad? Or suddenly we’re all using nuclear reactor failure language bad? Can we Apollo 13 our way out of this?
Also, small correction from earlier: you know that architecture diagram up there? The one with clean lines? You and I both know it’s a lie and there are things not captured in it, code or dependencies you come across in the wild and silently to yourself mouth, “oh no,” while contemplating laying face down under your desk to signal to others that, right now, you need alone time.

We use a lot of metaphors to describe technology, and I definitely do my part in this, so here’s another: systems are like gardens, they grow over time.
My father loves gardening, and as a child I remember he’d come home from work and go right into the garden, just walking around and taking it all in. He’d finally come back with a hand full of sticks and weeds he’d pruned and collected to compost or recycle before coming inside. He knew what was suppose to be in his garden, what wasn’t suppose to be there, and how to take care of each of his plants.
We couldn’t necessarily say the same thing about our system, so we performed an audit. Sounds exciting, I know, but it really was valuable. Every single part of the system, from large open source systems like Kafka and Zookeeper down to small helper libraries and even just configuration files were documented. We collected what version it was and when was that released, compared to the latest version and release date. We collected what language and version it was implemented in. We linked to Github repos for open source code and documentation about how to use the systems. We had everything in one giant document.
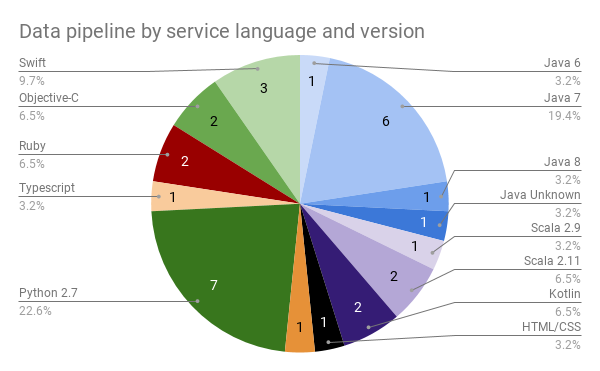
Breakdown of different data pipeline service languages and their versions, and release years for versions we’re using. You might think the unknown release year bar is terrifying but the unknown Java version is what really upsets me. [2]
Then and only then we could look at it and figure out what we had compared to what we’d thought we’d had. The State of the Pipeline, which summarized the audit, captured my opinions as the leading expert in the office on what I saw; others gave their feedback, so that finally — finally — we could start figuring out what we should do next.
Second system effect
In the wonderful Mythical Man Month, a book I cannot recommend enough, Fred Brooks describes one of the truest aspects of technology that I’ve ever encountered:
An architect’s first work is apt to be spare and clean. He knows he doesn’t know what he’s doing, so he does it carefully and with great restraint.
As he designs the first work, frill after frill and embellishment after embellishment occur to him. These get stored away to be used “next time.” Sooner or later the first system is finished, and the architect, with firm confidence and a demonstrated mastery of that class of systems, is ready to build a second system.
This second is the most dangerous system a man ever designs. [3]
“Here be dragons,” as medieval cartographers would say. I find keeping in mind Brooks’s words when starting a system design process to be important in perhaps, maybe, if you’re lucky, avoiding dragons.

How does the architect avoid the second-system effect? Well, obviously he can’t skip his second system. But he can be conscious of the peculiar hazards of that system, and exert extra self-discipline to avoid functional ornamentation and to avoid extrapolation of functions that are obviated by changes in assumptions and purposes. [3]
Knowing there are dragons, and knowing how dangerous our own work can be, the plan to replace our existing pipeline was done cautiously as if we were starting from scratch with nothing in our audit:
- We evaluated all possible options for our pipeline, though truthfully Kafka was the right choice back then and was still the right choice now for us and our data. The main boxes it ticked were being able to reconsume messages, having support for multiple languages, and wide community support and adoption.
- We looked into options for running and maintaining the pipeline, including hosted solutions, since (as anyone who’s sat a software engineering course in college knows) systems will spend most of their life under maintenance, and having engineers keep this system up and running was a pretty big expense in terms of time and knowledge as well as the least savory part of what the audit showed.
- We took stock of our producers and consumers of the pipeline, their priority in moving over, and our needs as a company now, several years into using them. This was relatively straightforward as our current setup only has two producers and one consumer, forming the most commonly interacted with part of the whole system for engineers, and thus the areas we knew the most about.
- We then were able to decide on the large epics, determine their ordering, and start filling in the details of implementation. The audit was particularly helpful here in reflecting on how the first system had grown and being able to point at each component to say, “This needs upgrading, this needs sunsetting, this needs something slightly different.” The audit, like data in a business decision, couldn’t replace a human’s judgement but could help confirm that we were on the right track.
Learning from Fred
What made the list of todos?
- set up new Kafka and Zookeeper clusters
- set up new Schema Registry cluster
- pick new consumer to act as an extractor and set it up
- write new producer libraries for two producers and integrate them into existing systems
- set up metrics and monitoring
- create documentation about the new system and runbooks for what we will still maintain
- tests???
That last item was particularly important to me, as a lot of the data team’s work is so stateful that it is incredibly difficult to test manually and nearly impossible in the current setup to test automatically. Having tests would let us know when we’d reached the definition of done for each of the items on the list; they would then double as the tests used going forward to ensure nothing is borked as the system evolves over time.
Striving to have a stronger emphasis on automated tests also forced us to think about things slightly differently, breaking out chunks of code that could be easily tested so that what is not so easy is as isolated and small as possible, to minimize risk. This led to us thinking of new edge and corner cases as we set up the tests for the purely functional code, and to capture the concerns of other engineers when they work with the system, so that those concerns could be automatically tested as well.

Speaking of the other engineers, part of my work in this phase included interviewing them as users of the producer libraries. As you may remember from my previous post, engineers are in charge of writing emitters which take in an event’s data and pass it to the producer for sending to the pipeline. Since they are often tourists to this area of code, asking them about their challenges and concerns was a wonderful chance to again inform what was actually important for this second pipeline system and what was only important in our minds.
I will certainly not contend that only the architects will have good architectural ideas. Often the fresh concept does come from an implementer or from a user. However, all my own experience convinces me, and I have tried to show, that the conceptual integrity of a system determines its ease of use. Good features and ideas that do not integrate with a system’s basic concepts are best left out. [4]
(If there’s interest for the specific design of the producer code, especially making it easy to work with Avro and the Schema Registry, let me know and I’ll be happy to write a post about that.)
Does the above list cover everything required to get into production and deprecate the old system? No, but it’s a start at the minimum required to at least get into lower environments and make sure we’re achieving parity.
“Achieving parity?” you might be saying. “How do you test that bold claim out?”
I’m so glad you asked.
Let’s do this
My background is in computer science, which often shows when I’m working with people who come from a purely engineering background. If this new second pipeline was a big experiment in “can we learn from the past without committing the second system effect sin?”, we needed to be able to prove it. We needed to be able to say to people, the data is still making it through at the same rate as the old system, if not better. Emitters are as easy to set up as in the old system, if not better. The ETL process will still work as in the old system, if not better.
Better has to be measurable. Better has to be visible.
With high risk, something to prove, and a big system, the path forward that made the most sense was a side by side deployment.
Simplicity, patience, compassion.
These three are your greatest treasures.
Simple in actions and thoughts,
you return to the source of being.
Patient with both friends and enemies,
you accord with the way things are.
Compassionate toward yourself,
you reconcile all beings in the world. [5]
A side by side deployment would allow us the time we needed to build out the new system and fix bugs as they cropped up, tuning it as we went along. It would also allow our resource constraint — that is to say, only I would be implementing that big ole todo list — to not stop the whole project as we delivered things bit by bit.
If every week, we could say, “Here’s how things are getting better already,” better became measurable and visible.
More importantly, if every week, I could say, “Here’s how things are getting better already,” I could keep going without feeling overwhelmed by the task ahead of me.
Our producers produce into both pipelines.
Our consumers each consume from their pipeline.
We can compare the data collected and metrics generated.

We’ve got a plan.
Harvesting
Obviously this post doesn’t cover the details of getting each todo list item checked off (but, again, I can write one that does if people want to hear about it), and we’re still working on closing out the last bits of what remains, but already we’re seeing the new pipeline do great things while also getting to enjoy some of the benefits within the old system.
For example, a lot of engineers who write emitters complained of the boilerplate that existed, so I condensed what’s required to just the bare minimum with the system instead then fluffing out the data before sending it to both pipelines. (That’s the refactoring project discussed here.) This then also meant we had a lot of pure functions we could test, and a way to automatically test every emitter could do things like encode its data.
export class PersonEvent extends BaseEmitter<PersonInterface> {
    public topicName = 'person';
    protected doc = 'Represents a person and an associated user if they have one.';
    protected fields: AvroSchemaField[] = [
        { name: 'id', type: 'string', doc: 'the id of the person' },
        { name: 'user_id', type: 'string', isNullable: true, doc: 'the id of the user associated with the person, if one exists' },
    ];
}
Sample of what an emitter now looks like. That’s it, everything from producing to the pipeline to filling in things like when the event happened are done automatically within the producer, which is evoked from the base emitter. [6]
The best way to both measure and see the benefits is through our metrics dashboards, which I’ve become obsessed with looking at and comparing to the old pipeline’s figures, as it lets me see in real time how the system is doing as I deploy new pieces. My favorite dashboards in particular are:
- an overview dashboard that takes your through the flow of the whole system, showing on the left a link to more details and on the right the single most important metric to tell if that piece of the system is healthy or not. It starts with producer errors, goes through the pipeline, and then ends with our ETL process and data warehouse, so you can compare everything quickly and easily as data flows through the system.

Example from the overview dashboard for the pipeline. The left links to the more detailed dashboard; the right shows the top metric and colors to indicate if it’s in a good or bad state. The emojis are just for fun. [7]
- a data status dashboard that zooms in on if the producers are encountering errors and what data was invalid, dropped, or had some other failure. Again this links to more details but also allows the data team to see a list of events impacted and by how much, should there be an outage or bad deployment. We’ve set this up for the older pipeline as well and it’s where you can really see how the new system has nearly no errors while the older one, even on a good day, drops data pretty regularly.
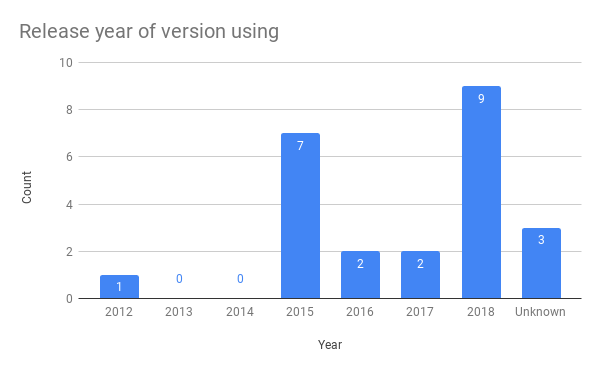
- the new producer dashboards, which again show metrics as a flow through the system, from connecting to emitting to encoding to producing. Coloring once more plays a big part in helping people know, whether in an incident or just curious, if things are fine, questionable, or on fire. We also, where helpful, show a comparison to how we were doing last week, as some days might be more spiky than others but week over week tends to follow the same trend.
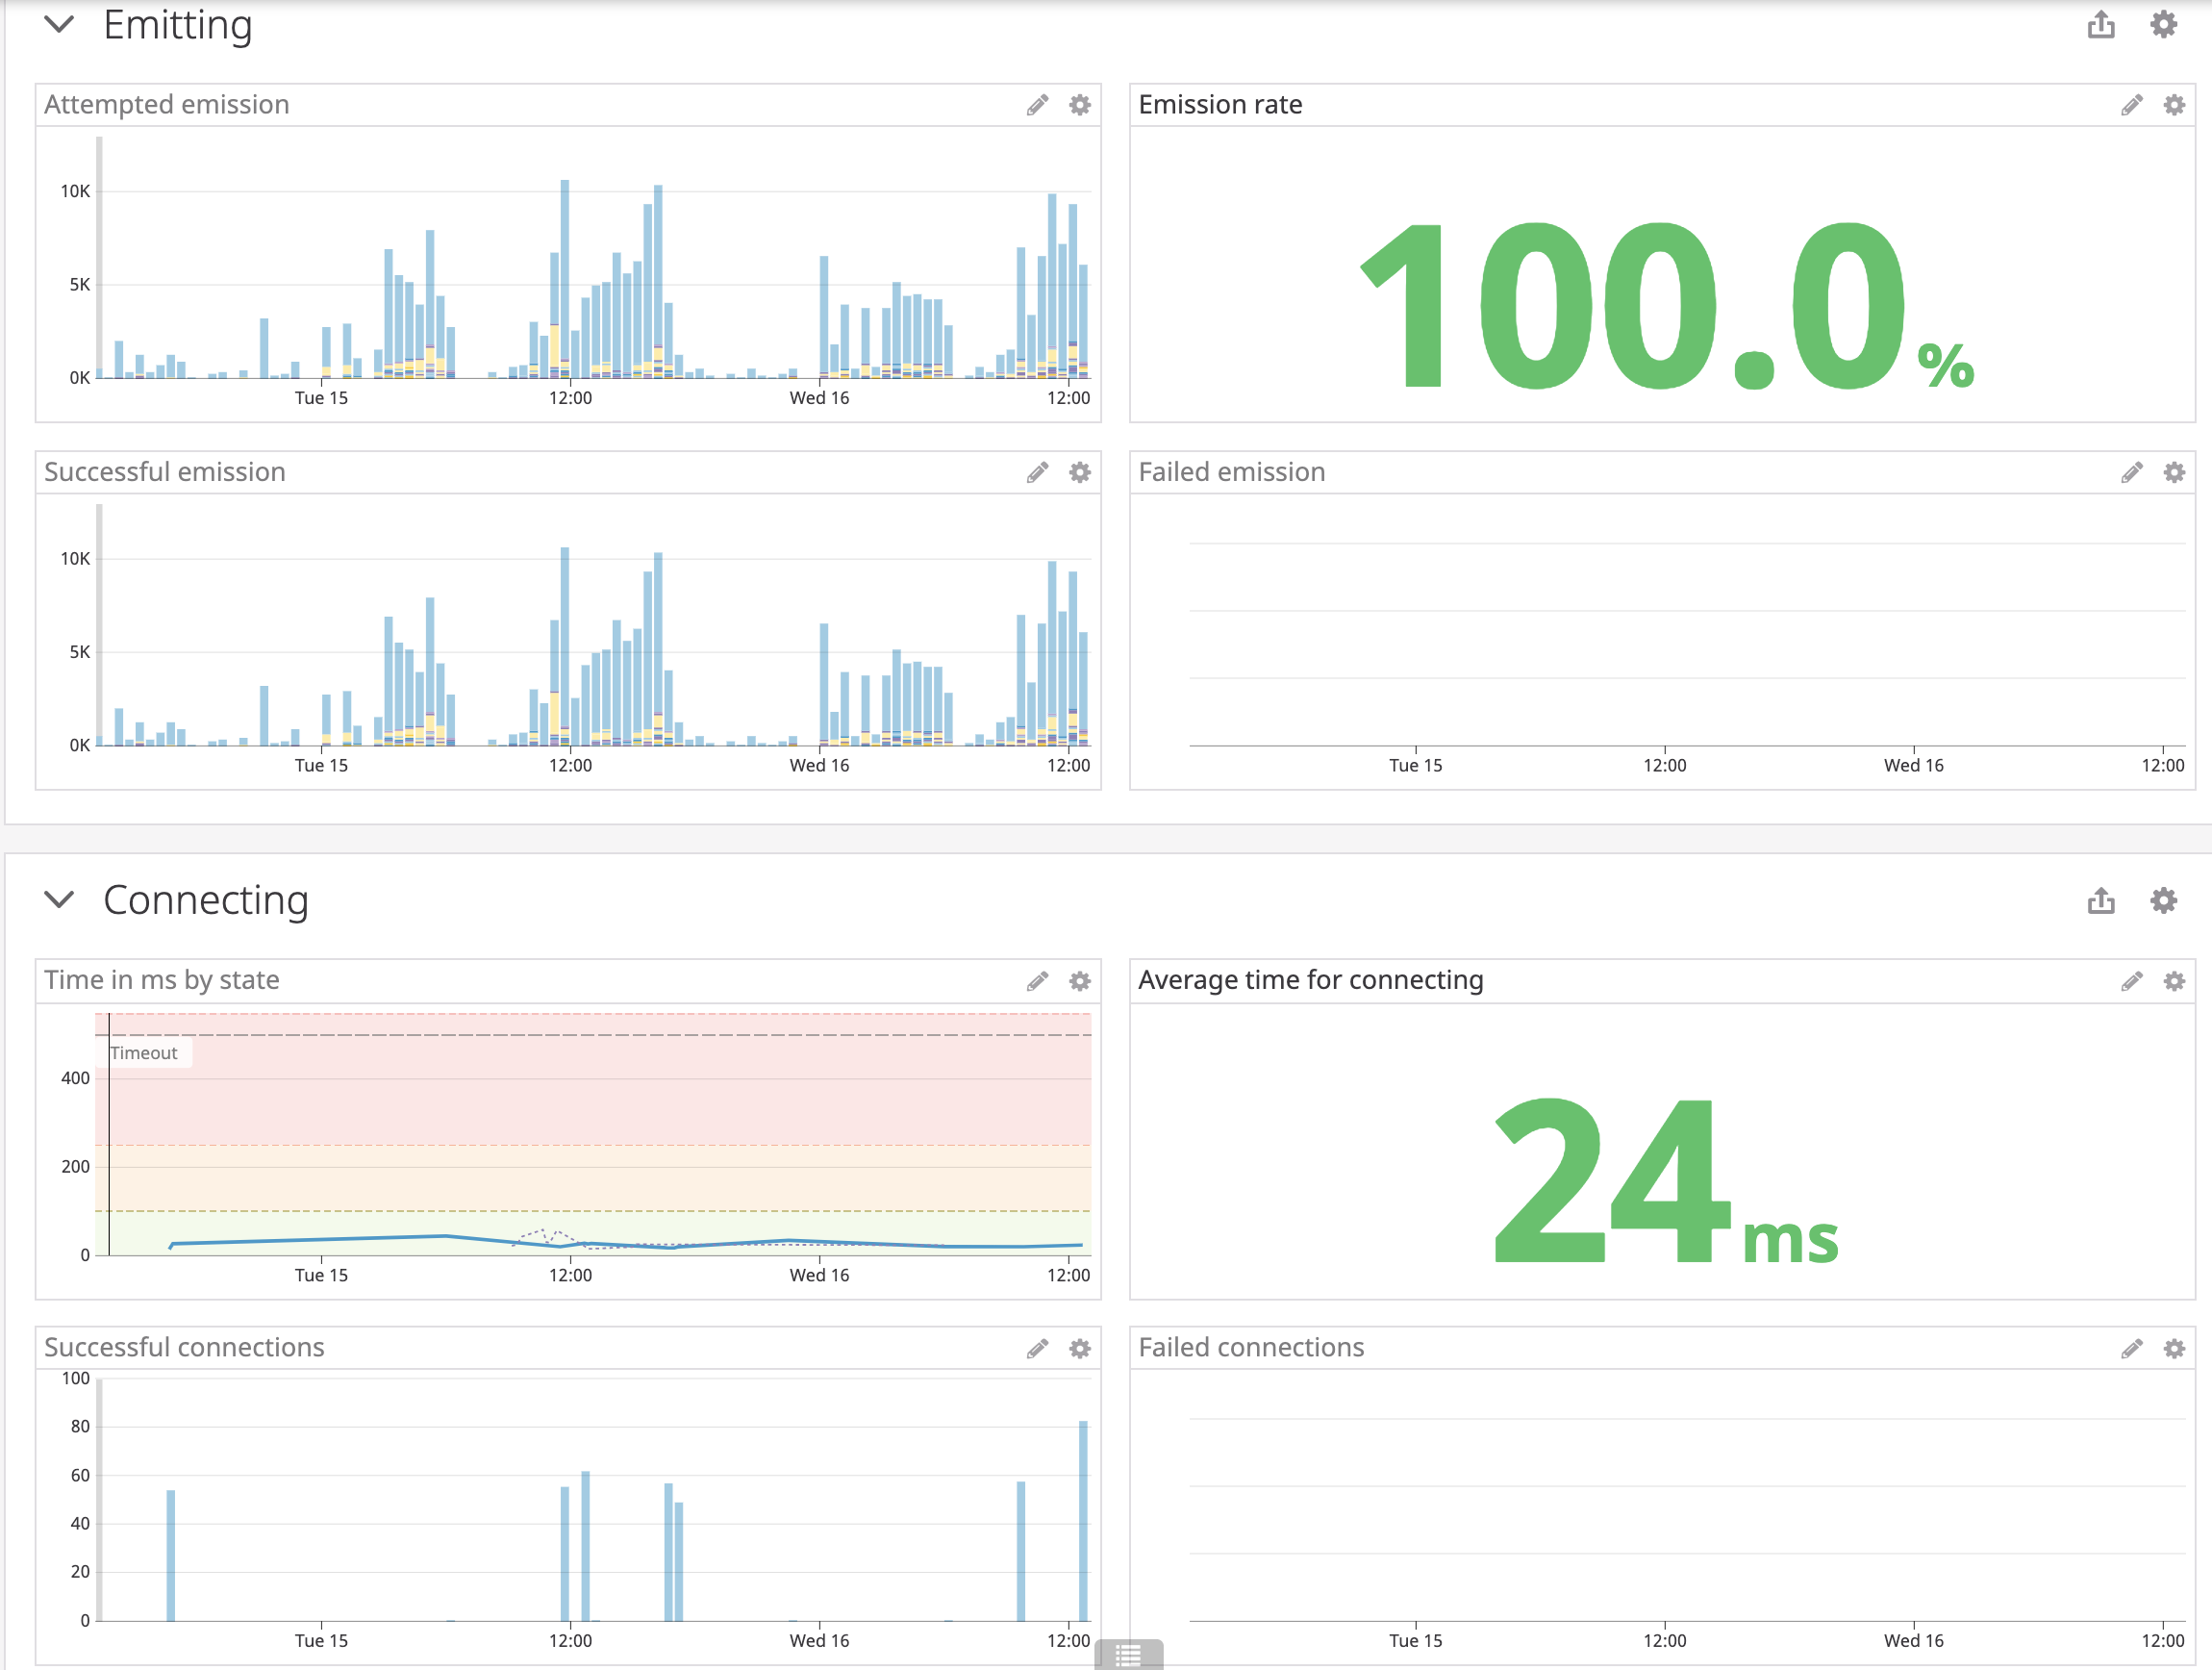
Example from a producer dashboard. Each section of the dashboard is laid out with the overview and a big number showing times or success rate, then the breakdown of successes in blue and failures (if any) in red. [7]
- the pipeline dashboard, which is so much tidier now that we no longer host our own Kafka and Zookeeper clusters but instead use a hosted solution. I’ve invested time as the office’s expert on this system into carefully marking the ranges of good and bad so that if something happens, I’m not required in the heat of the moment to figure out the state of things.
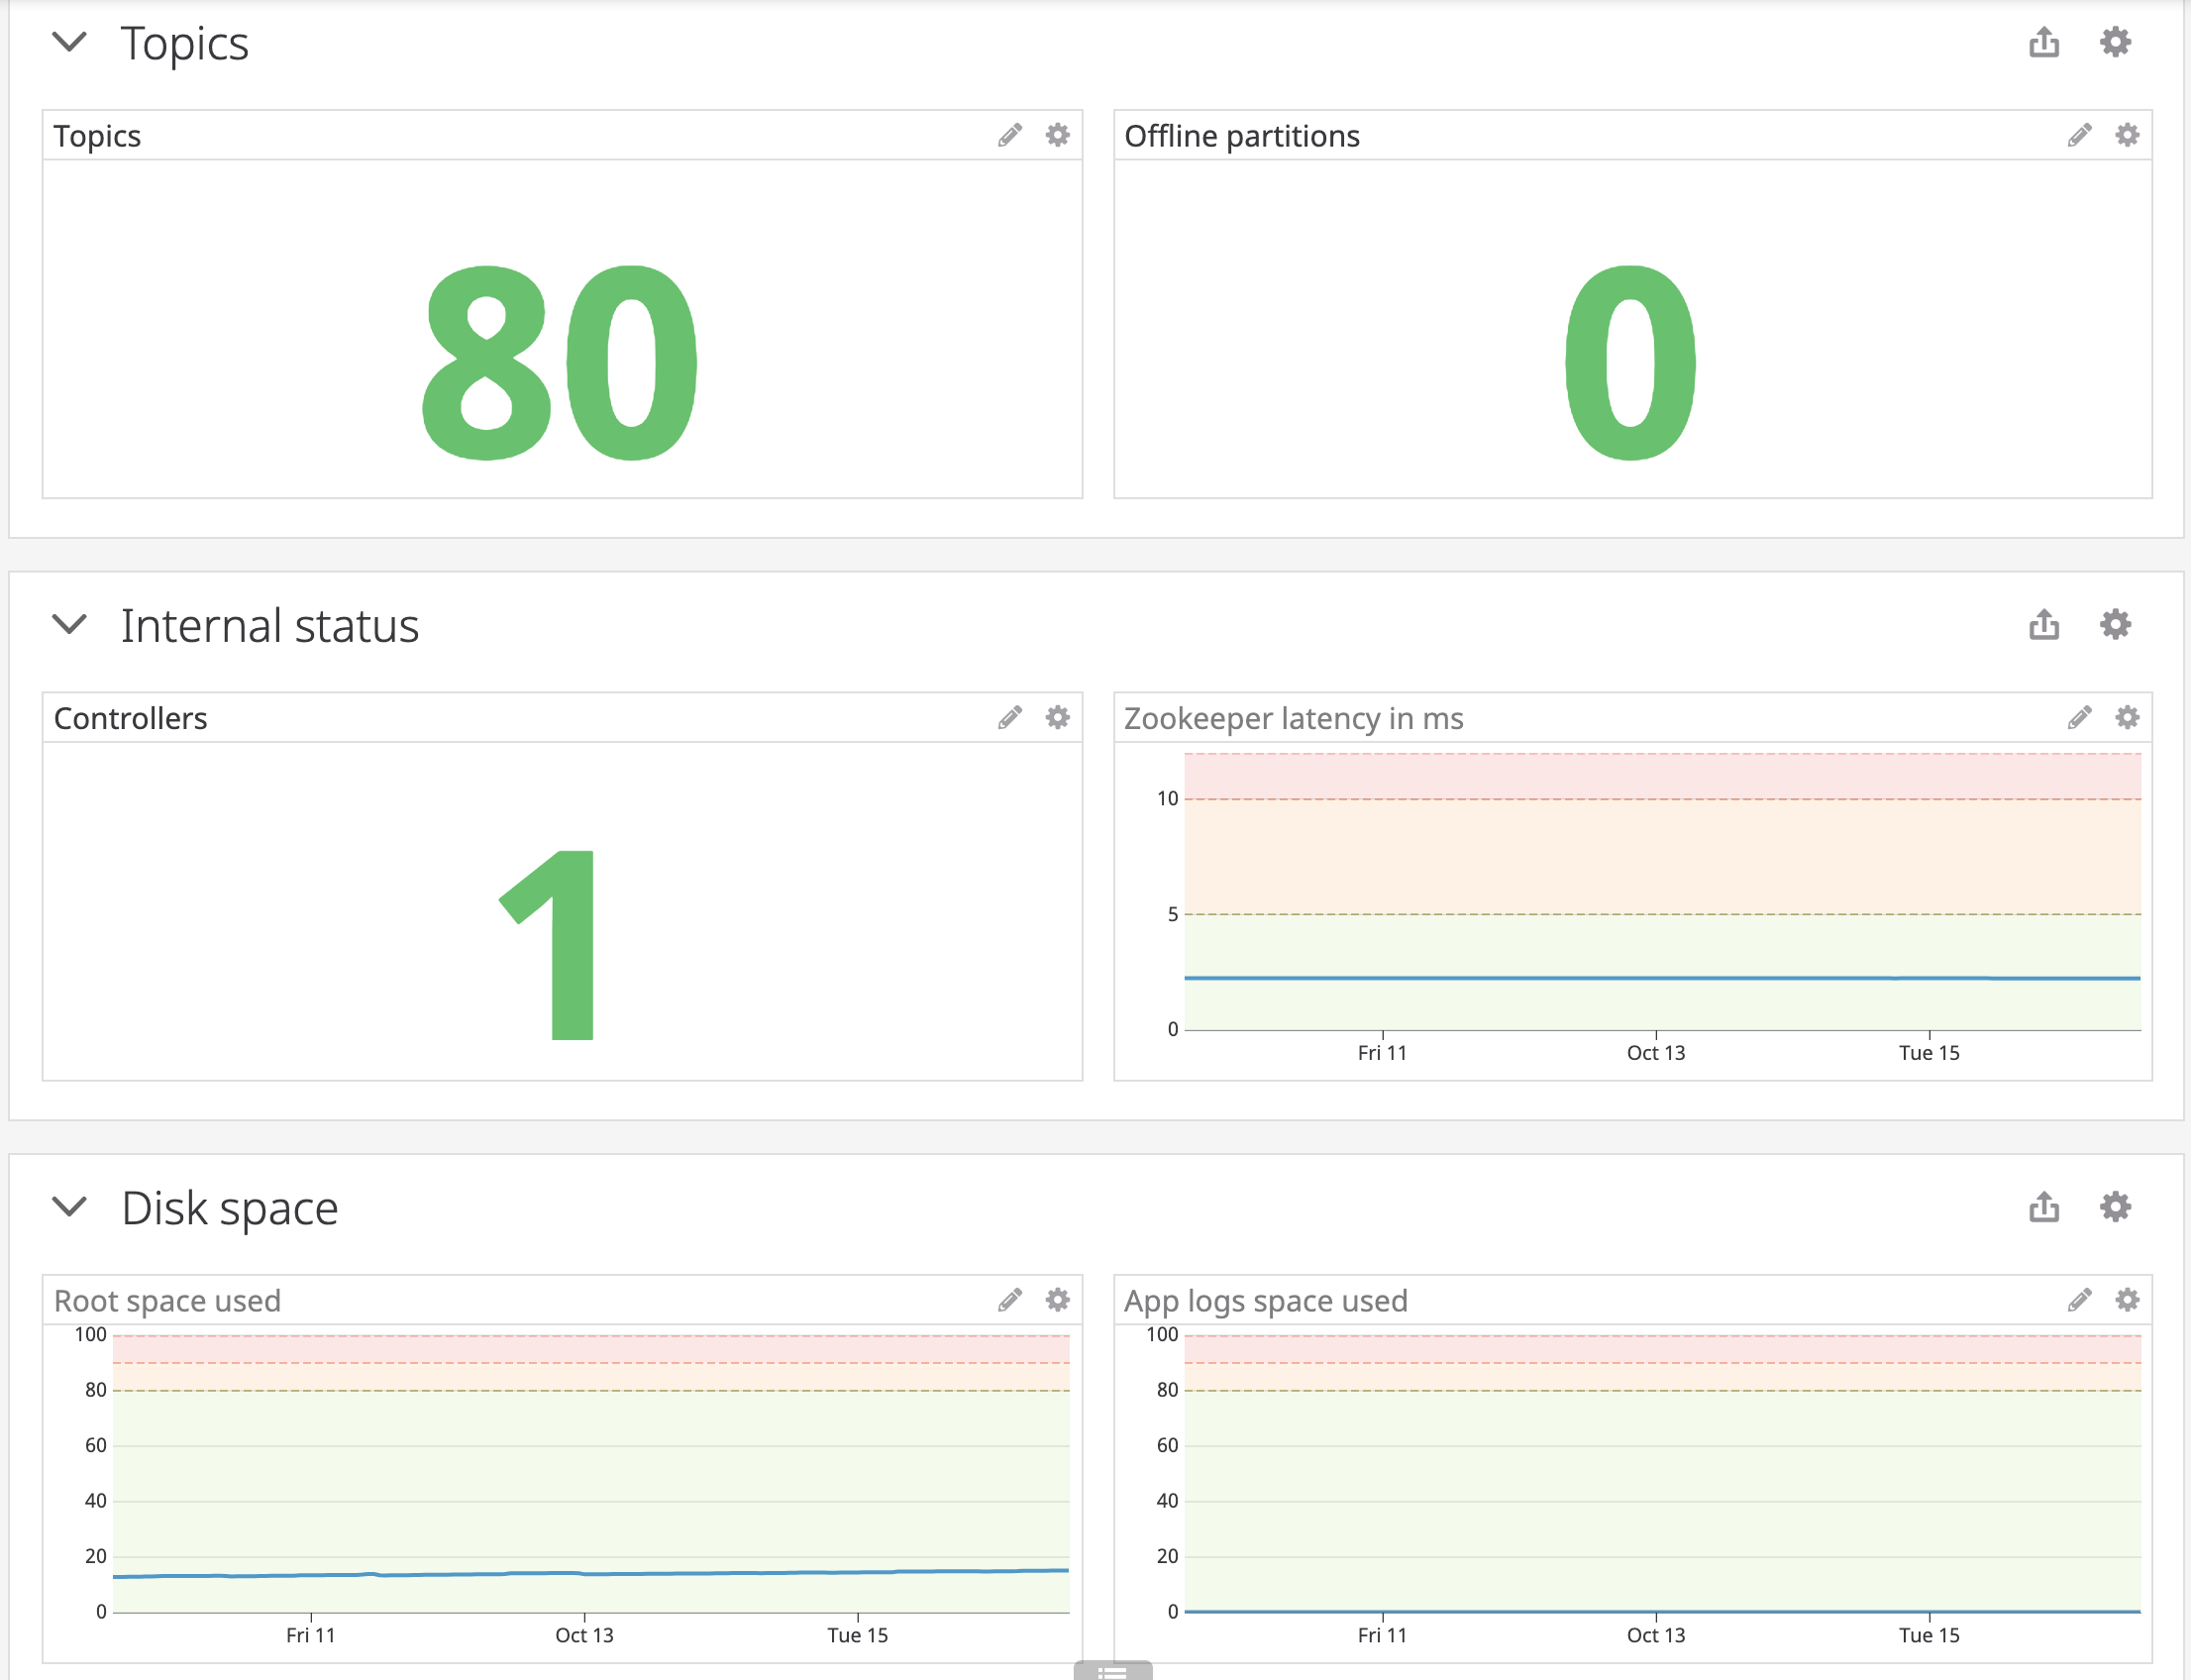
Example from the pipeline dashboard. This one relies the most on color so that no one has to remember how many controllers we should have or if an offline partition is bad or not. [7]
What does all this show us? That we’ve begun harvesting what we’ve sewn before the project’s conclusion, whether in changes we made that are already live or in the side by side comparison. The goal is, once the full pipeline is deployed, to switch between versions for where we’re pulling the data from and see if we can find differences that require further changes in the new pipeline. If so, we can rollback and make the changes without interrupting the normal flow; if not, then we’ve achieved parity, which is all we’re currently after.

I was going to put in a picture of one of my Minecraft farms for the harvesting metaphor, but they’re not terribly aesthetic so here’s a random picture of a sunrise instead. It captures the calm feeling I have when a new part of the pipeline works as expected and its metrics are all smooth. [8]
Final thoughts from a data engineer
This project has been way too massive and as small as possible and a headache inducer and a load of fun and a great learning opportunity, all rolled into one. A system like this requires a certain amount of investment, because a stable data pipeline is the foundation that allows smaller producers, consumers, or streamers to be worked on, spun up, or sunsetted independently with low effort.
One of the main concerns we wanted this system to be able to address was not getting into the same state that brought this system into existence: we shouldn’t be afraid to upgrade our version nor stuck on an old one, nor should we have code we must maintain but don’t feel we fully understand. The new pipeline should be able to grow and change with us, rather than having to be worked around. It should be easy for tourists to visit and understand, but also for the rest of the data team, including scientists and analysts, to conceptualize and make use of.
A leader is best
When people barely know he exists
Of a good leader, who talks little,
When his work is done, his aim fulfilled,
They will say, “We did this ourselves.” [5]
There’s still a long road ahead, from getting the new pipeline hardened and into production, to deprecating the old pipeline, to making use of the power we now have at our hands. But the main benefit has been that everyone in the office understands what’s being worked on, from the data team to the other engineers, to QA and designers and the office manager, to the CTO and CFO. Everyone is able to come in, look around, and say, “I understand and can ask questions if I want to, because I know enough to feel comfortable doing so.”
Along the way, I’ve been capturing as much as I can for posterity, whether its in reference documentation stored as close to the work as possible, to articles and books that helped informed my thinking for whoever might have to retrace my steps. Below I’ve linked some of my favorites for you, if you’ve made it through all of this and want moar.
In the end, my main recommendations are:
- you will forget everything you did, so keep the code simple, your naming verbose, and your tests obvious
- you will forget what everything means, especially under pressure, so add annotations to your metrics and dashboards
- test driven development, functional programming concepts, and strong typing make everything infinitely easier when working together
- you will regret most of the choices you made eventually, so keep in mind you will delete this code to replace it with something else, and that’s quite alright
- friends make things easier, so have a pipeline friend or two when implementing your system who are also on the project
- we’ve learned nothing since OS/360 so read Brooks’s book, and then read it again
- if you’re working with Kafka and have your choice, the JVM makes things so easy, especially Scala, so learn and use it
- if you’re working with Kafka, have someone else host your cluster — it’s worth the money
People tend to think systems like Kafka are too complicated to be useful, but really there’s just a need to learn its basics before it becomes easy (and not hosting your own cluster, I cannot recommend that enough). If you then keep your system built around it tidy, observed, and up to date, it’s smooth sailing thanks to the potential Kafka unlocks.
If not, to quote my favorite line in The Bard’s canon,
The fault, dear Brutus, is not in our stars,
But in ourselves [9]
Watch out for those dragons.
Recommended readings
- Write code that is easy to delete, not easy to extend
- Write code that’s easy to delete, and easy to debug too
- Mythical Man Month by Frederick P. Brooks Jr.
- The Log: What every software engineer should know about real-time data’s unifying abstraction
- Apache Kafka’s design
- Kafka Streams in Action
- Streaming 101: The world beyond batch and 102
- Programming in Scala by Martin Odersky, Lex Spoon, and Bill Venners
Footnotes
- Architecture diagram by fellow GameChanger Joshua, first appearing in my previous tech post
- Siobhan Sabino, yes I am citing myself
- Frederick P. Brooks Jr., Mythical Man Month, Chapter 5: The Second-System Effect
- Frederick P. Brooks Jr., Mythical Man Month, Chapter 4: Aristocracy, Democracy, and System Design
- Lao Tzu, Tao Te Ching
- Code sample from Typescript service
- Dashboards in Datadog
- Screenshot from Minecraft, a game I should not have bought myself
- William Shakespeare, Julius Caesar